There are innumerable ways to quantify the health of a landscape, rangeland or otherwise. Evaluating ecological health at a single point in time is likely to produce uncertain results. Perhaps it was a dry year or there has been a particularly bad pest problem. Such seasonal and intra-annual variations in local conditions can be challenging to incorporate into studies when evaluating a landscape. Often times research must be conducted over a long time period to get at the average conditions, and often times the changes to the landscape occur at a rate or magnitude that is hard to detect. To help overcome some of these issues, and to reach beyond the short history of the Ucross High Plains Stewardship Initiative, we have begun a time series analysis of the Ucross Ranch.
Two-dimensional Change Vector Analysis
In this context, time series analysis draws on the archive of satellite imagery captured over roughly the last four decades. While neither the research team nor many of our collaborators were present at our study site over a generation ago, we can harness the strengths of early satellite missions to look back in time. Where earth-monitoring satellites capture reflectance data at regular intervals, we can examine the relationships between images from multiple years, developing a detailed landscape chronology from past to present.
Change Vector Analysis
The use of satellite imagery to analyzed landscapes from the past is by no means new, and there are a wide variety of techniques to employ. We have begun a research program that capitalizes on one particular technique known as Change Vector Analysis (CVA). Conceptually, CVA is simple: One obtains quantitative measurements for a landscape characteristics from two different dates. Then, one of the values is subtracted from the other to come up with the direction of change (i.e. positive, negative, or somewhere in between) and the magnitude of change. Change Vector Analysis relies on mathematical vectors (strings of numbers), and can be applied to complex multidimensional data structures where change and magnitude are identified across a number landscape attributes. Consider a simple example:
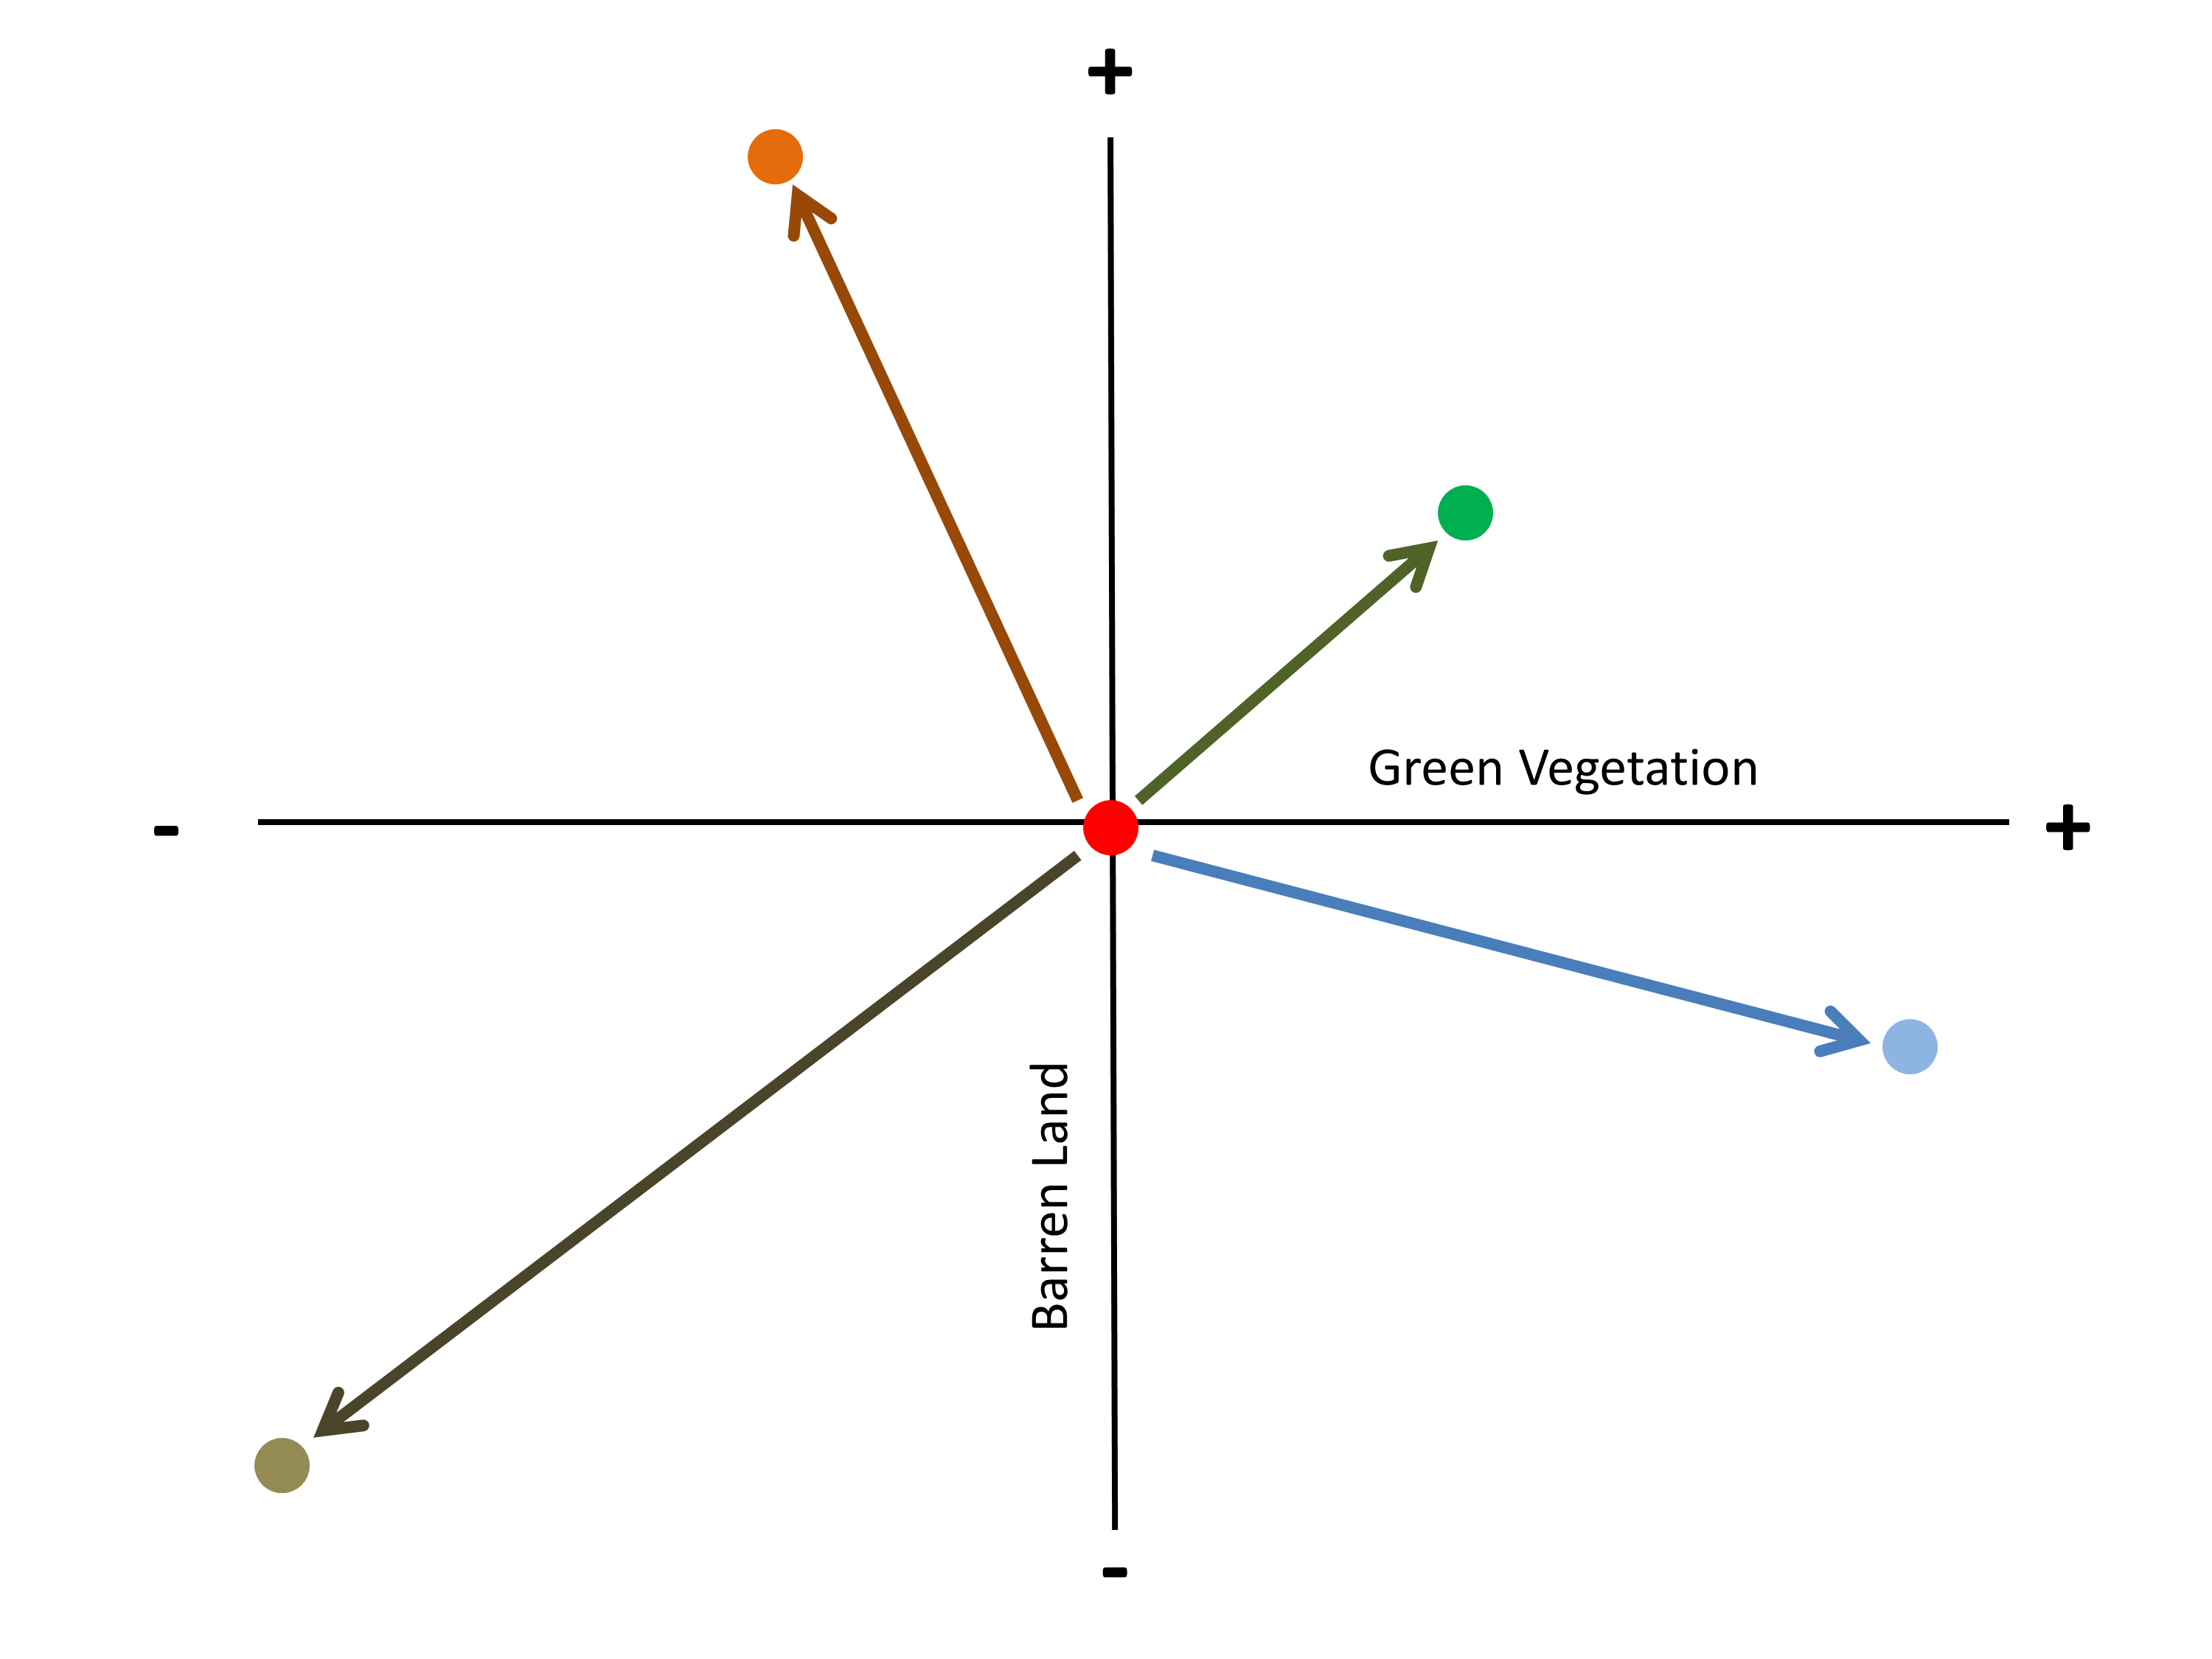
When working in two dimensions, CVA can be represented with the figure above. Here we are concerned with calculating the differences between two growing seasons: Year 1 and Year 2. During Year 1, vegetation and barren land (the two characteristics in which we are interested) at a specific location are measured and have specific quantitative values that make up a two number vector. One number corresponds to the measurement of barren land and the other to a measure of vegetation presence. These values become the origin of a Cartesian plot, represented by the red dot. Then, the difference between the values are calculated between Year 1 (red dot) and Year 2 (the other colored dots, representing four of many possibilities). Generally speaking there are four quadrants of change. In our analysis we will hope to find change direction that matches the blue arrow, which indicates an increase in vegetation and a reduction in barren land. The length of the arrow corresponds with the magnitude of change, and greater mathematical magnitudes correspond to more marked change on the ground. When this technique is applied to multidimensional data, visualization becomes very challenging.

Compiling multiple CVA findings (i.e. multiple pairs of years) onto a single moving axis plot allows you to visualize long-term trends across a landscape. In this example the color of the dots reflects the type of change that occurred between two dates, and the distance between dots reflects the magnitude of the change between those dates. Here you can see that there is generally a trend toward more green vegetation and less barren land, and that the magnitude of change was greater during the earlier years.
The heart of this research program is to evaluate ecological shifts in rangeland health that have occurred in response to managerial shifts on the Ucross Ranch. Peer-reviewed literature on the efficacy of alternative grazing practices (e.g. rotational grazing, high intensity grazing, Merrill system grazing, controlled rotation grazing, etc.) does not speak highly of these techniques over traditional open range grazing. However, range and livestock managers continue to use these techniques because they perceive noticeable improvements in ecological and livestock health. Through literature review it became apparent that the lack of strong evidence for alternative grazing practices stemmed largely from the over-objectification of management strategies. Many of the alternative strategies fall, loosely, under the adaptive management umbrella because their success relies on direct operator intervention. Ranch managers change their plans, objectives, and strategies on a day-to-day basis, ensuring the needs of the livestock, the landscape, and the managers are all met simultaneously. It is no surprise that controlled studies, in which the effects of daily intervention are removed, show limited success. By using CVA, we hope to be able to demonstrate quantitatively that adaptive management strategies can lead to clear and marked improvement of rangeland health, livestock health, and micro-economic health, helping land managers meet their triple bottom line.