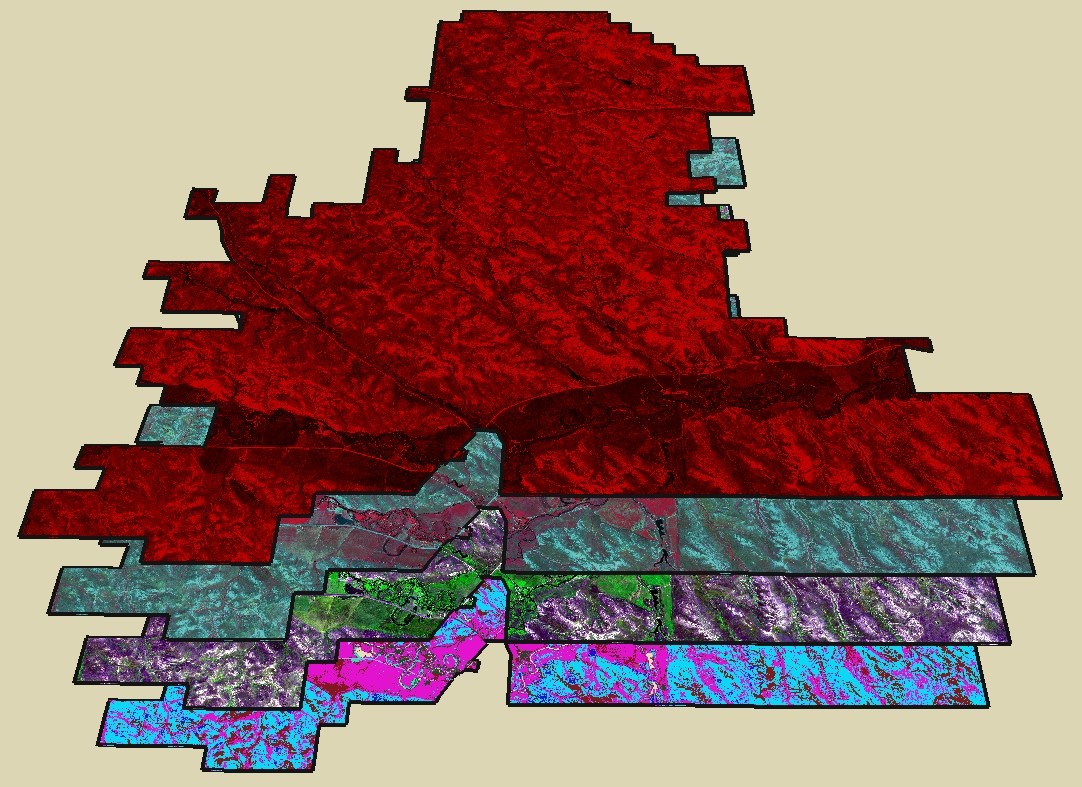
An example of a multiband satellite image for the Ucross Ranch
Land cover refers to that which is covering the ground at any given location, and is not to be confused with land use, or how a landcover functions from an anthropocentric point of view. Land cover is a landscape attribute that plays a major role in supporting all levels of the food chain, adding organic matter to soil, decreasing erosion, improving soil water retention, sequestering carbon, and guiding human livelihoods, among others. UHPSI has devoted considerable time to analyzing and developing maps of ranch-wide land cover, as well as to evaluating the accuracy of those maps.
Land cover assessment relies on (1) time spent in the field documenting the geographic locations of specific cover types (e.g. sagebrush, deciduous forest, asphalt road, etc.); (2) analysis of imagery captured by satellites; and (3) evaluation of the analyzed satellite imagery. Land cover assessment can be undertaken manually, on foot, but that would take far too long on the 22,000 acre Ucross Ranch. So instead, UHPSI has relied on multispectral satellite sensors from the WorldView-2 satellite to do the heavy lifting. These sensors capture reflected light, much like your digital camera. But unlike your camera, which records reflected light visible to the human eye, satellite sensors can capture reflected light from wavebands that humans cannot see. The WorldView-2 satellite captures reflected light across eight different wavebands. Each one appears like a grayscale image, and collectively they can be thought of as a stack of images. For a given point on the ground, represented in each image by a pixel (just like your digital camera), there are eight unique values that comprise that location’s spectral signature.
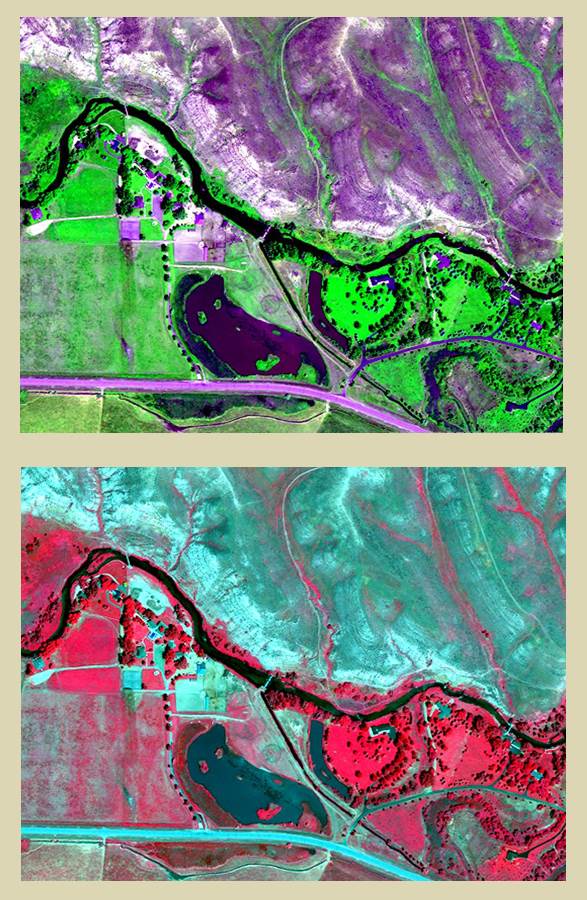
Visualizing land cover using combinations of visible colors (red, green, and blue) to represent reflected light that is not normally visible to the human eye
After documenting the specific locations of land cover types gathered in the field, we identified the unique spectral signatures for each of the land cover types on the Ranch by looking at the imagery. Then, using computer power, we used mathematical algorithms to identify all of the pixels in the image stack that have a spectral signature similar to grassland. We did the same for deciduous growth, hay, asphalt, and many others. In this way, the algorithms help to parse the millions of pixels that comprise the ranch-wide image stack into land cover classes of interest. This technique is referred to as “supervised classification”.
The final step in classifying satellite imagery is to assessment the accuracy of the classification using still more data gathered on foot in the field. Locations with known cover types can then be compared with what has been predicted by the computer algorithm and then accuracy statistics computed.
Land cover assessment is a fundamental precursor to many other forms of analysis, as it provides a baseline picture of what is happening across the entire ranch at a given moment in time. From a land cover map we can capture statistics on land cover at given locations, on the relative proportions of cover types, and with multiple capture dates we can evaluate land cover change.
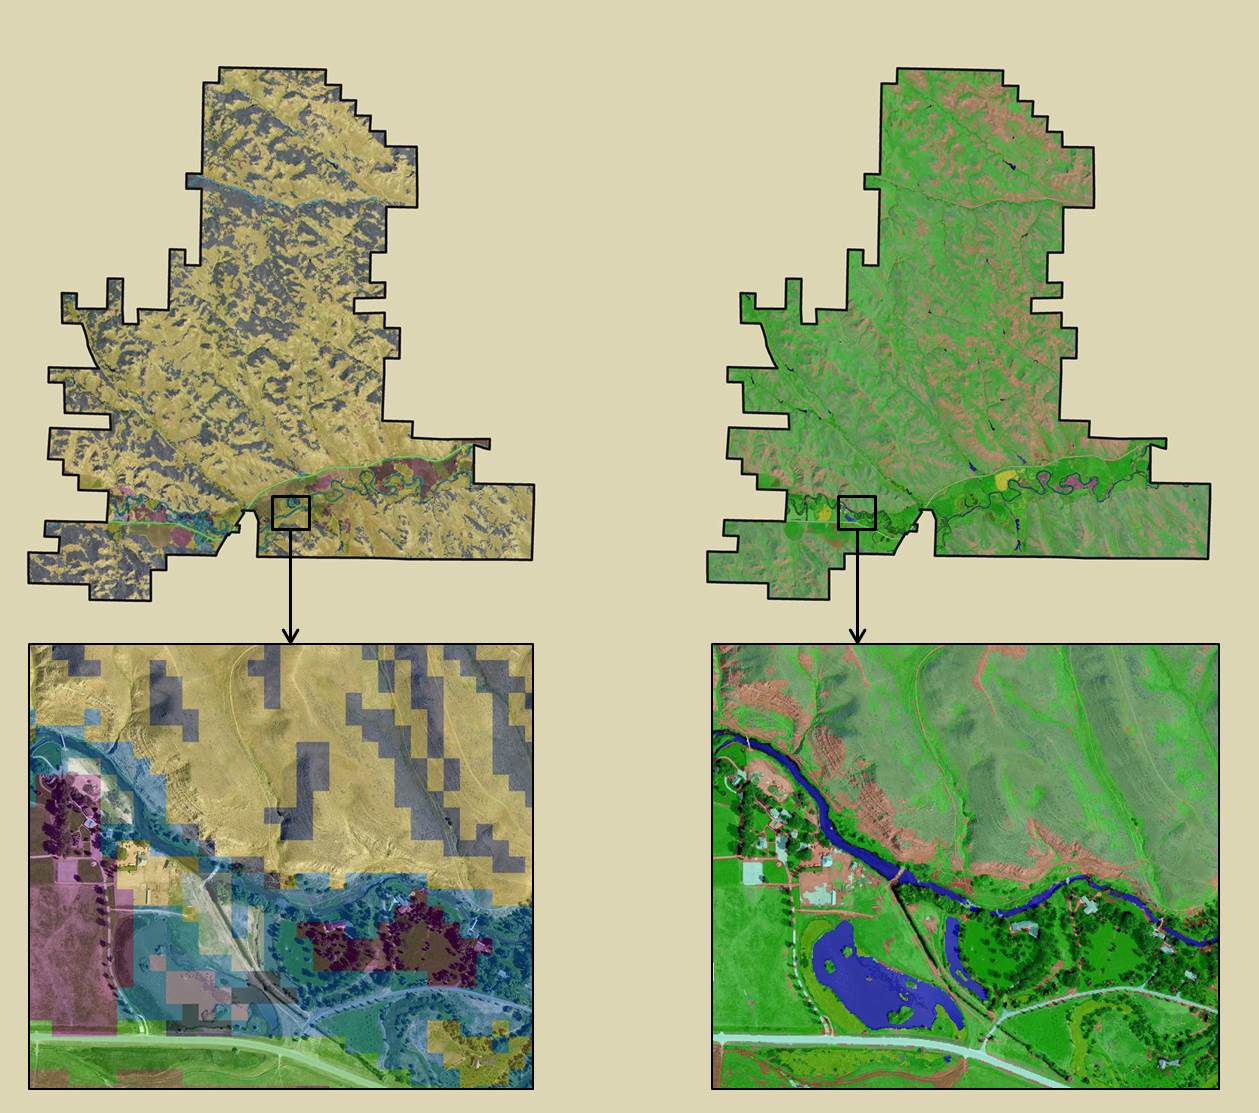
Visually comparing the National Land Cover Database (left) to UHPSI’s high-resolution classification