Over the last eight months at Ucross High Plains Stewardship Initiative, our team developed a set of tools to assist in monitoring areas surrounding beaver dam installations in eastern Montana using remote sensing. One of these tools is focused on calculating normalized difference vegetation index (NDVI) across an area of interest and how it is changing over time. The purpose of this blog post will be to help explain what exactly NDVI is and how it has developed over time.
When satellites capture spectral data about the surface of the Earth, they are measuring light that has been reflected by the atmosphere, clouds, water, vegetation, etc. However, the light that is reflected is not equal. The light varies in wavelength (the distance between the top of each wave) because the sun emits light at different wavelengths due to difference in temperature and density. Each satellite has a variety of sensors that allow for the capture of this reflected light at different wavelengths. It is this difference in wavelengths that give satellites their different band information. These bands cover the visible light spectrum that we as people can see, but it also measures wavelengths beyond that, including into the infrared and thermal realms. For example, the bands of the Sentinel-2 satellite are ultra blue, blue, green, red, near infrared 1-4, and shortwave infrared 1-4 (see figure 1). Every molecule in the universe has a distinct spectral profile, the proportion of light that is reflected at each wavelength. Chlorophyll, the photosynthetic machinery of most vegetation and the dominant component of green vegetation, has a spectral profile with a distinct peak. The peak is centered on the red-near infrared wavelengths. Normalized Difference Vegetation Index is simply a way to exploit the distinct spectral profile of chlorophyll to measure green vegetation coverage (see figure 2). The formula considers the red and near-infrared bands of satellite sensors (see figure 3) and allows for easy comparison of green vegetation coverage across landscapes. Including the difference in the calculation allows for NDVI to be compared across all landscapes.
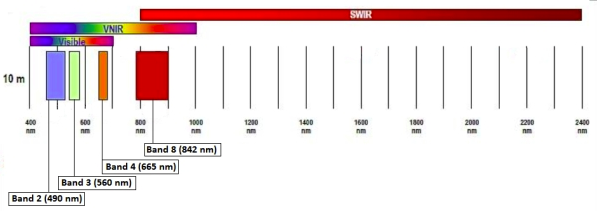
Figure 1: The 10-meter resolution bands available for Sentinel-2. Band 4 represents the red section of the spectrum and band 8 represents the near infrared. NDVI for Sentinel-2 is calculated using bands 4 and 8 (1).
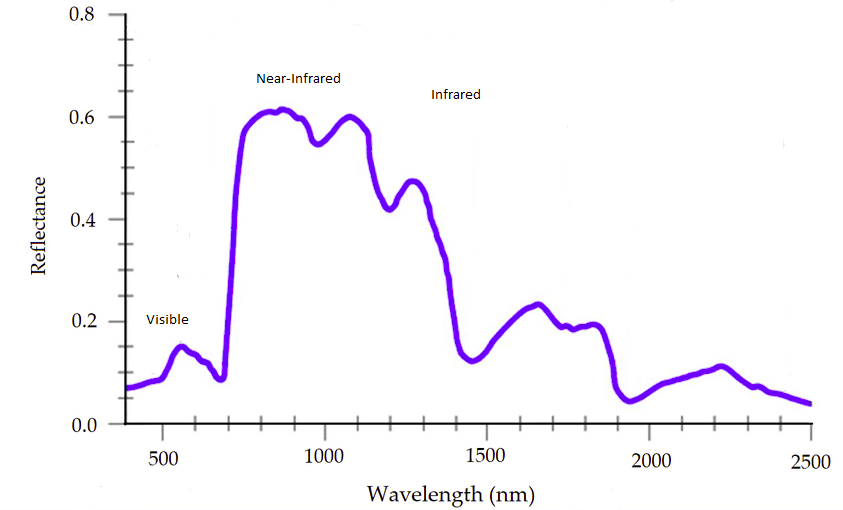
Figure 2: The spectral reflection profile of chlorophyll. The obvious peak begins in the red section of the light spectrum and continues through the near-infrared section (2).
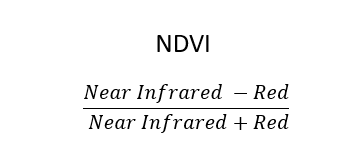
Figure 3: The equation for NDVI.
Now we know how NDVI is calculated and what it means, but how did we arrive at this measure and how useful is it really? In July of 1972, NASA launched a satellite called the Earth Resources Technology Satellite, eventually renamed Landsat 1, which was the beginning of the famous Landsat remote sensing project. As part of the project, NASA provided funding for a team of researchers in the Great Plains of North America to investigate how this new technology could be used to advance our understanding of vegetation cover and health. Leveraging the distinct spectral profile of chlorophyll, this group of researchers realized that the red and near-infrared wavelengths would allow them to capture greenness of vegetation, and NDVI was born. Following the research produced by this group, near infrared and red became standard sensors on future satellite remote sensing products and NDVI became widely used. In the 1990s, a team of researchers published research that found strong correlations between aboveground net primary production and NDVI3 (figure 4) as well as between greenness and NDVI4. With these publications and the many others surrounding NDVI, it has been well accepted that NDVI can provide valuable information at the local to global scale on vegetation changes.
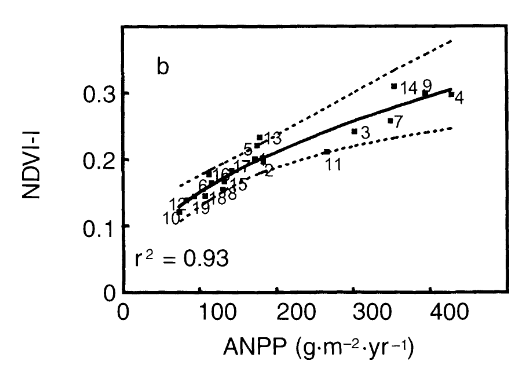
Figure 4: A graph with the x-axis showing NDVI and the y-axis showing aboveground net primary production (3).
When we developed our tool for monitoring areas around BDAs in eastern Montana, we had the luxury of decades of work that came before us. NDVI is well studied, well understood, and well accepted by the scientific community. We were able to use this knowledge to leverage the incredible library of satellite data in making a tool that could be used to understand a niche topic at a local scale. In my opinion, that is the best part of remote sensing. Data and research from all scales combine to create incredible insights at all levels and on all topics.
Works Cited:
1. Maathuis, B. & Retsios, B. ITC SENTINEL EO4SD TOOLBOX V2 INSTALLATION, CONFIGURATION AND USER GUIDE OF THE SENTINEL EO4SD Toolbox Version 2. (2020).
2. Moroni, M., Porti, M. & Piro, P. Design of a Remote-Controlled Platform for Green Roof Plants Monitoring via Hyperspectral Sensors. Water 11, 1368 (2019).
3. Paruelo, J. M., Epstein, H. E., Lauenroth, W. K. & Burke, I. C. ANPP Estimates from NDVI for the Central Grassland Region of the United States. Ecology 78, 953–958 (1997).
4. Paruelo, JoséM. & Tomasel, F. Prediction of functional characteristics of ecosystems: a comparison of artificial neural networks and regression models. Ecological Modelling 98, 173–186 (1997).