As temperatures climbed this summer, so did the elevations of the plots that I visited. My gradual ascent was an attempt to capture the plant community of each site at a time when I would be able to detect and identify most of the plant species. Higher elevations mean lower temperatures, and while many grasses and other herbaceous plants at lower sites have set seed and retreated into a drought-avoidant state by late July, cooler montane sites are still near full bloom.
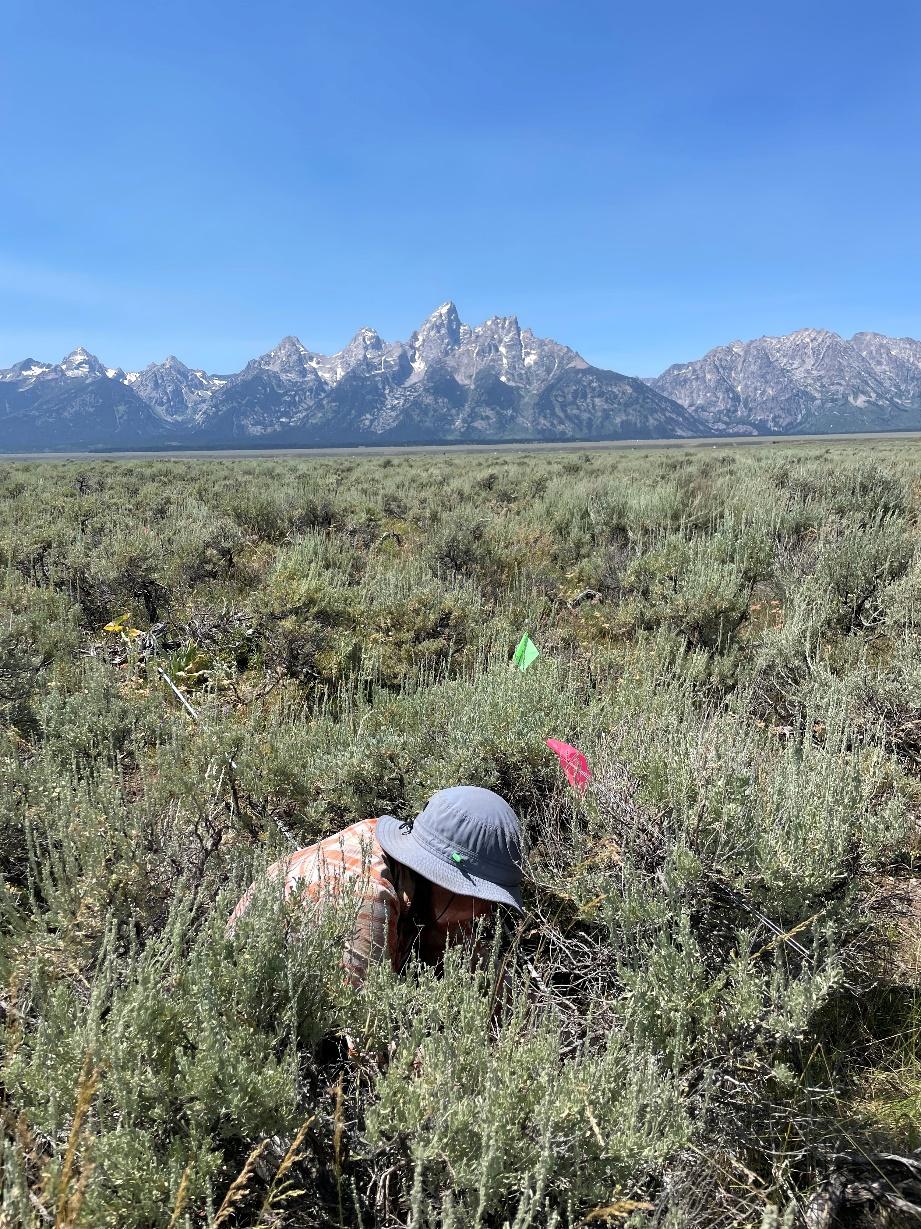
Squeezing my way between sagebrush to measure herbaceous plants under and between shrubs at the last plot of the season in Grand Teton National Park. Photo credit Jasmine Gormley.
The last week of July found me at the eastern edge of Grand Teton National Park, thrashing and crawling my way through a dense plot of mountain big sagebrush (Artemisia tridentata Nutt. ssp. vayseana (Rydb.) Beetle) to measure herbaceous plants under and between shrubs. In a landscape like this, the meaning of “between shrubs” starts to blur. Abundant moisture and gentler summer temperatures lend confidence to the shrubs here, and in many places, they have stretched out to rub shoulders with their neighbors, casting the understory between them into mottled shade. After eight hours of strenuous (and graceless) traverses up and down each of the three 25-meter transects through the fractious sagebrush at this site, Jasmine (my field technician and third-year Environmental Studies student at Yale College) and I packed up our gear for the last time and headed back to our home base in Missoula, Montana.
A few days later, I found myself marooned1 in the depths of the Greater Los Angeles Metropolitan Area, a population center that is home to over 22 times more people than the entire state of Wyoming2. After two and a half months of rigorous proximal sensing3 of big sagebrush ecosystems, I had arrived in Pasadena, California to try my hand at remote sensing at the Computer Vision for Ecology (CV4Ecology) Summer School at Caltech.
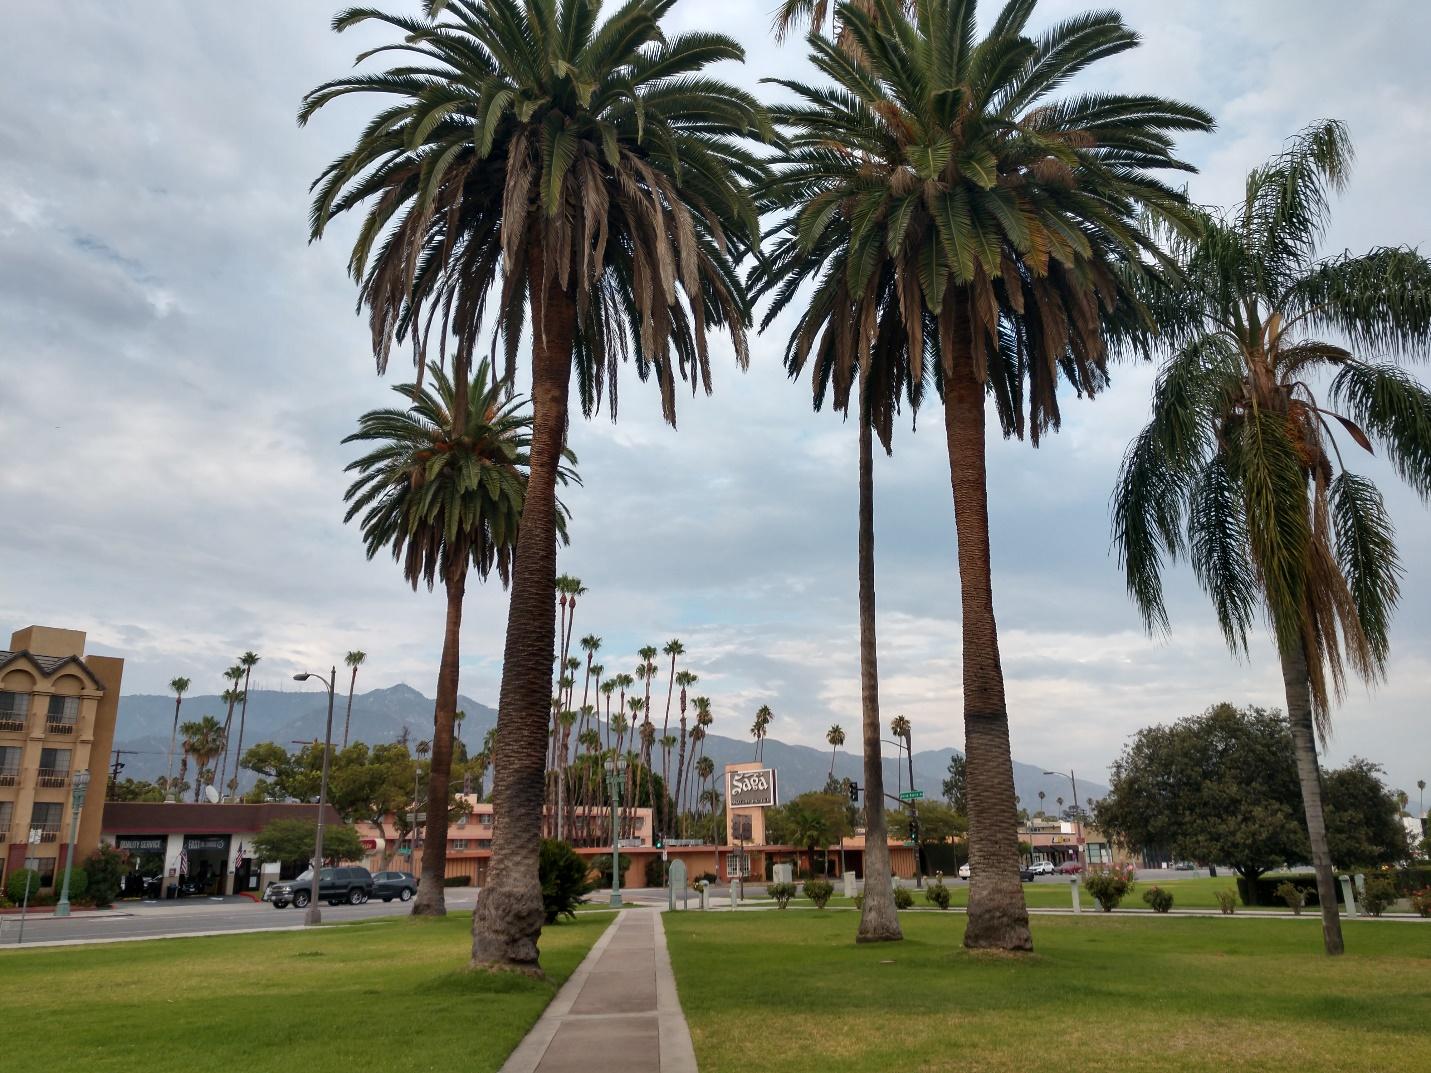
Looking north towards the historic Saga Inn—a classic stop along Route 66 in Pasadena—where the CV4Ecology Summer School housed students and instructors during the three-week program.
Remote sensing is a term usually applied to observation of the Earth from above using sensors that capture different frequencies of electromagnetic waves, including those that can be detected by a human sensor (visible light can be detected by the eyes, and thermal infrared radiation can be detected by the skin). Although several of the students at the Summer School (including me) were working with images collected by satellites or aircraft, all our projects (and computer vision in general) are effectively a form of remote sensing—that is, instead of physically measuring the environment or organisms, we are extracting (in our case, ecologically) relevant information from images (or audio converted into images!) using complex computer algorithms called Convolutional Neural Networks (CNNs).
The convolutions that led me to spend three weeks wafting around Caltech’s lemongrass-scented4 campus in August began last spring (2021) as I selected sites for the field-based project that I worked on this summer—investigating shrub-grass interactions across gradients of soil moisture. To find sites where the plant community would be most likely to be influenced primarily by climate and soils (the two dominant controls of soil moisture), I attempted to identify relatively undisturbed areas across the big sagebrush region using large geospatial datasets (e.g., fire perimeter polygons, a land treatment database, and land cover datasets).

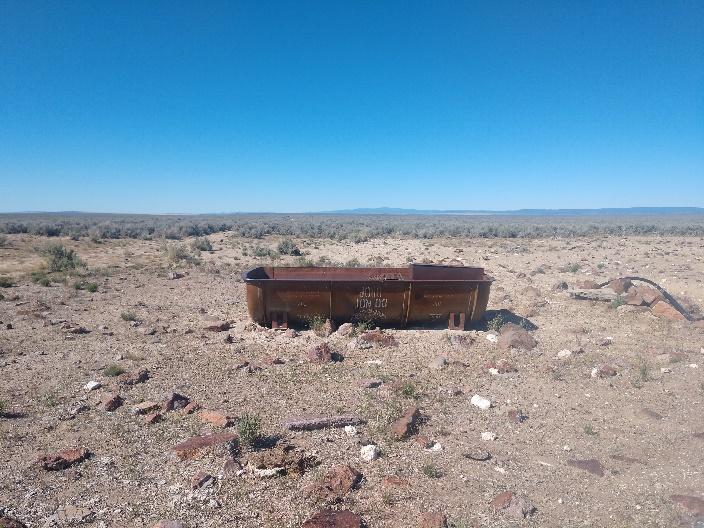
Piospheres associated with salt blocks in central-western Nevada (left) and a water tank in eastern Oregon (right).
Disturbances that disproportionately affect either grasses or shrubs have the potential to alter the interactions between these functional types and obscure the underlying influence of resource availability on these interactions. For example, fire is more likely to kill shrubs than grasses, potentially leading to higher-than-expected grass cover post-fire. Similarly, preferential grazing of grasses by cattle could systematically disadvantage grasses and lead to shrub cover that exceeds expected values based on climate and soils alone. Although fires are relatively well documented5, there is no comprehensive database for grazing intensity for the big sagebrush region. Instead, we often rely on a cow’s aversion to thirst to construct theoretical gradients of grazing intensity around water sources. In drylands, surface water is sparse, and cattle will tend to spend more time closer-to rather than further-from water, so that points that are distant from water probably experience much lower grazing intensity than points that are near to water. Leveraging this concept, I constructed 2000-m buffers around water bodies, springs, and well-points identified in the National Hydrography Dataset (NHD)6 and excluded these buffered areas from my potential sampling sites across the big sagebrush region.
Yet, in my first season of field work for this project (2021), it was not uncommon to travel all day to get to one of the sites that I had selected, only to find abundant cow sign on the plot (e.g., dung, trampling, grazed grasses). Inevitably, I would notice some attractant nearby that was either missing from the NHD dataset (unmapped wells or water troughs not associated with wells) or for which no dataset exists (e.g., salt blocks or supplemental feed). Although these attractants are invisible in current publicly available datasets, they are quite visible in aerial imagery as features known as piospheres. Piospheres are characterized by a dense network of animal trails that converge on an attractant (e.g., a water trough or salt block), which is surrounded by a zone of heavy use and consequently, vegetation is sparse. These features can be readily identified by manually searching high-resolution imagery—which makes the challenge of finding piospheres across large areas a good candidate for delegation to a computer armed with a well-trained CNN. So, when I saw the announcement for the CV4Ecology Summer School last fall, I knew exactly what project to propose in my application!
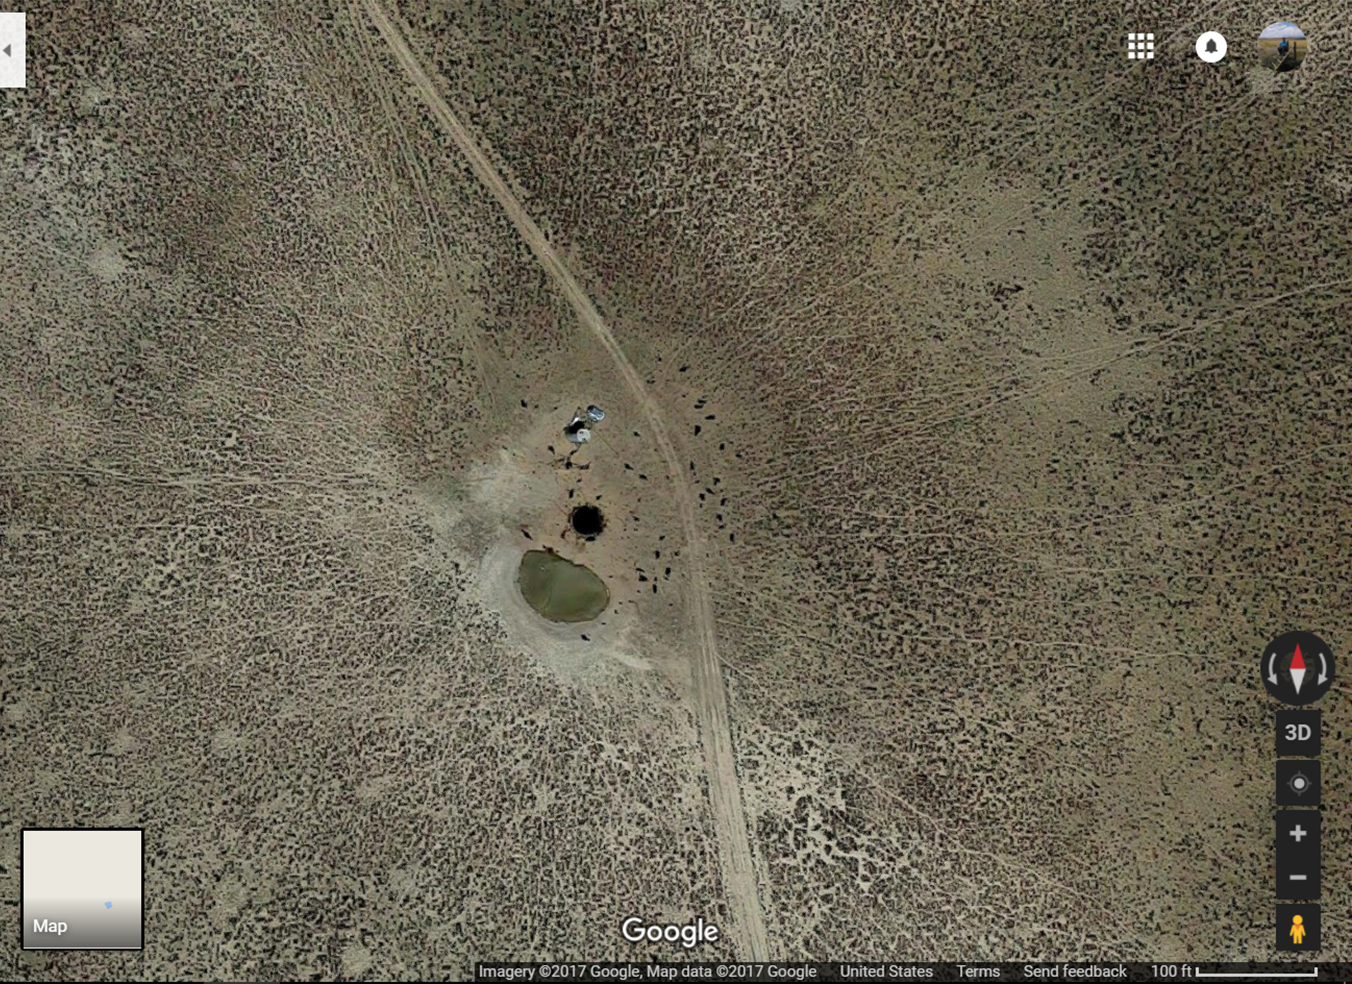
A piosphere in Wyoming associated with a well, as seen on Google Earth.
When I found out that I was accepted to the program in the spring, I began the task of developing a prototype dataset to test the potential of computer vision models to detect piospheres in North American drylands. All summer, between forays to near and distant corners of the big sagebrush region, I hunkered down with my computer in Montana to search for piospheres using Google Earth, then coerced aerial imagery7 into 256×256 pixel image chips that I could label as training data for my project.
At Caltech, our amazing cast of instructors and teaching assistants guided me—and 17 other students—through a quick-start to training and testing computer vision models on our data. For three weeks, we began each day with a technical lecture and a presentation from an invited speaker, followed by several hours of work time. During the lectures, we learned the details of adapting existing models for new applications, improving predictions through data augmentation, and assessing model performance. The invited speakers came to us from non-profits, government agencies, academia, and industry. Each one offered a glimpse into yet another facet of the burgeoning kaleidoscope of computer vision technology and applications for ecology. Beyond the classroom, the three weeks I spent in Pasadena were an opportunity to get to know a very unique subset of people who—like me—are working at the intersection of machine learning and ecology.
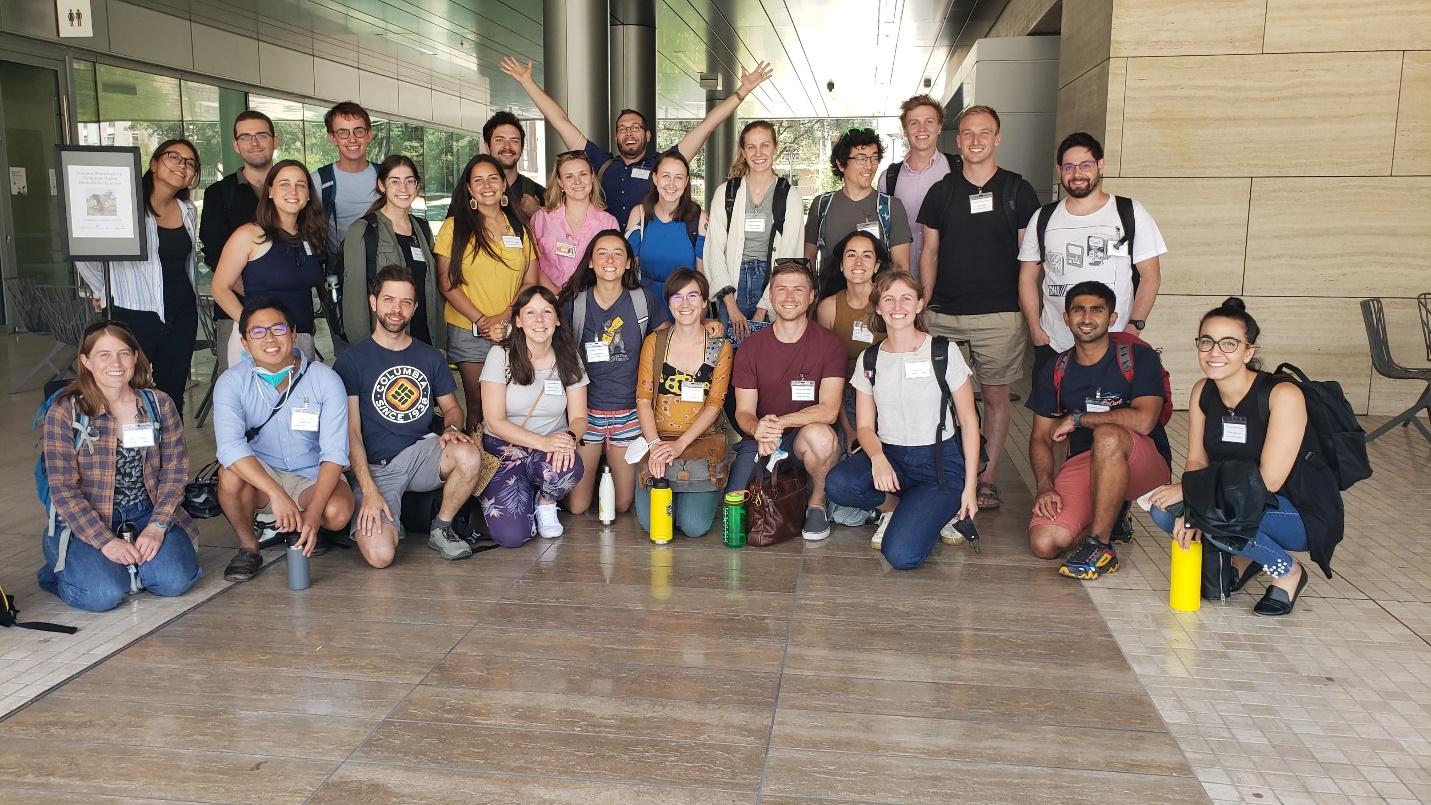
My peers and instructors at the CV4Ecology Summer School at Caltech in Pasadena, California. Photo credit Caroline Murphy and Sara Beery.
When the end of August ushered me back to New Haven, I brought with me much more than a carload of soil samples and a computer full of field data. I also have a promising collection of preliminary results from a rudimentary computer vision model trained to detect piospheres, and a supportive group of friends and peers, fully connected—first through our network of interests, and now by our shared experience at Caltech.
1From Miriam-Webster: to put ashore on a desolate island or coast and leave to one’s fate
3My nickname for manual collection of field data using things like rulers, measuring sticks, shovels, saws, field technicians, and taxonomic keys.
4By week three I was finally able to trace this redolence to the uncommonly well-kempt eucalyptus trees growing around campus.
5https://data-nifc.opendata.arcgis.com/datasets/nifc::wfigs-wildland-fire-perimeters-full-history
6https://www.usgs.gov/national-hydrography/national-hydrography-dataset7https://www.usgs.gov/centers/eros/science/usgs-eros-archive-aerial-photography-national-agriculture-imagery-program-naip