Once covering nearly half of the American West, sagebrush ecosystems are now among the most threatened in North America. In the past century, climate change, human land use, shifting disturbance regimes, and the introduction of invasive plants have driven significant loss, fragmentation, and modification of sagebrush communities.
As part of my research, I will characterize neighborhood interactions of big sagebrush plants. Resource neighborhoods will inform aspects of competition related to community recovery. Once disturbed, big sagebrush communities are difficult to reestablish, and the intensity of disturbances caused by oil and natural gas extraction results in long recovery times. Understanding competition for limited resources is relevant to understanding succession within a gap-dynamics framework.
While I initially planned to characterize neighborhood interactions by capturing drone imagery of sites and measuring size characteristics at many sites over the 2020 summer, travel restrictions put a moratorium on developing my sampling protocol. As a result, I sought to obtain drone imagery of my sites from an outside source—anticipating that I may not be able to travel to Wyoming to do field work—and was grateful to obtain high-quality imagery of my sites from a third party. Sites are 100 square meter plots of undisturbed sagebrush community within 100 meters of well pads. Below is a stitched-together image of a test plot made up of four images.
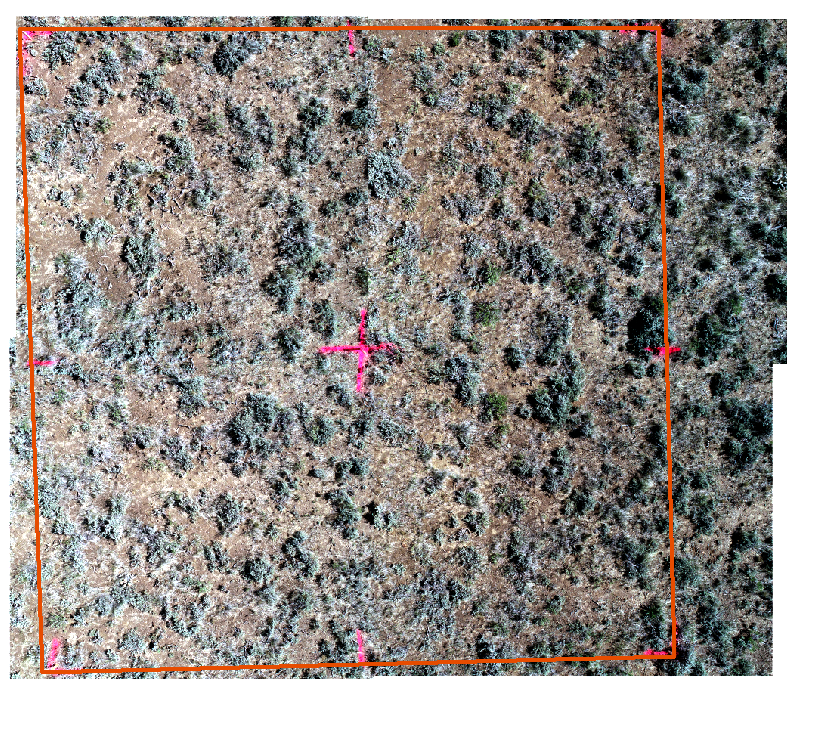
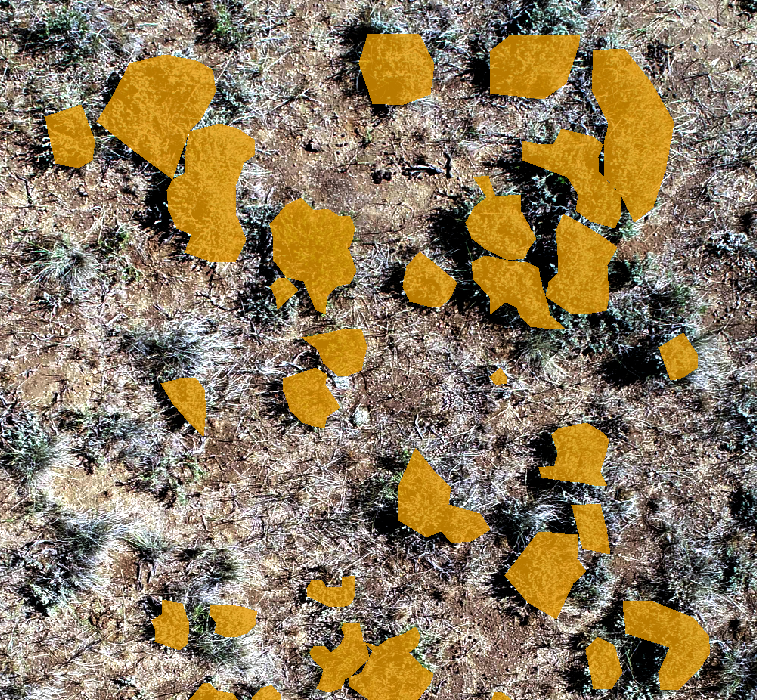
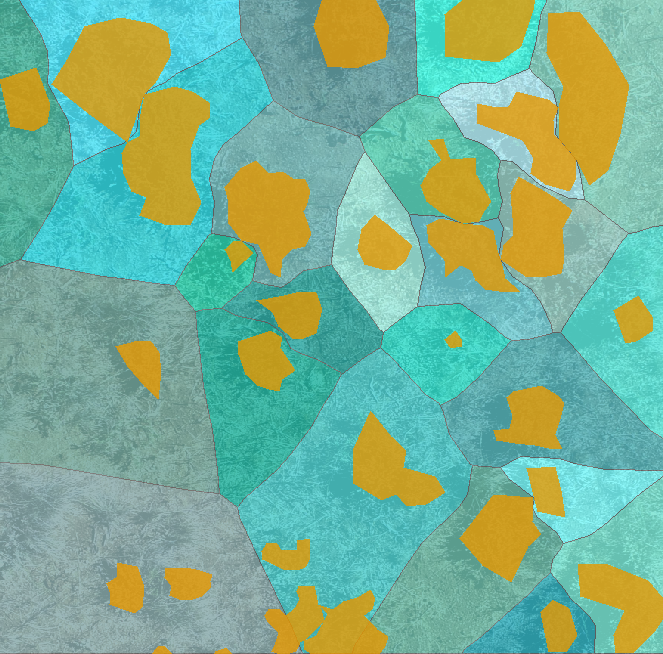
The red outline represents the 10 x 10 meter plot boundary. Following the methods used by Aguilera and Lauenroth (1993) in their exploration of neighborhood interactions of Bouteloua gracilis, I have begun to digitize the sagebrush canopies seen in the plot image and extrapolate resource neighborhoods of plants using GIS. The images below show a test of this method, where the yellow polygons represent sagebrush canopies and the blue polygons their respective neighborhoods.
Despite setbacks in the Spring and Summer, I am thankful now to be able to travel to Wyoming, and in the coming weeks will locate these plots and measure size characteristics like height and canopy size of the plants I have already begun to “map,” and will be able to pair these plot maps with data collected in the field.
STUDENT RESEARCHER
Damaris Chenoweth, Western Resources Fellow and Research Assistant | Damaris is a Master of Environmental Science candidate at Yale School of the Environment. Her thesis research focuses on modeling sagebrush community regeneration in areas disturbed by oil and gas extraction. At Ucross, Damaris assesses the vulnerability of conservation targets to climate change in a region known as The Crown of the Continent. For this project, she works closely with US Fish and Wildlife to contribute to a larger Landscape Conservation Design. Blog